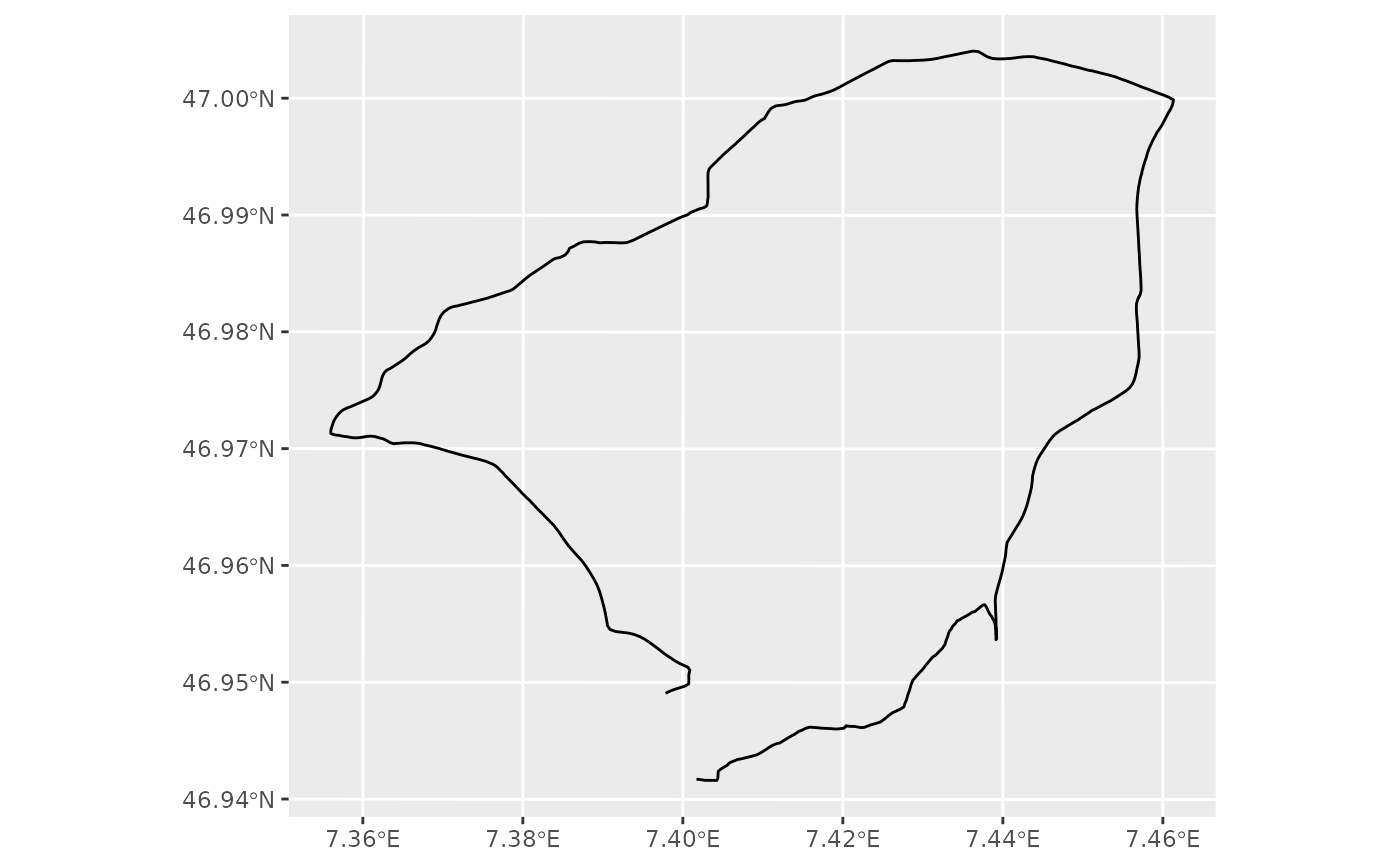
Plot a Single Track with a Given Date
plot_track.RdTakes a date, and a collection of points, then plots a track of all points which have the same
date as the one specified.
Points with NA values for latitude and/or longitude will be filtered out.
Remaining points will be converted to_linestrings() before plotting.
Return value is the plot object, i.e. additional plot layers can be added in the usual ggplot way.
Value
a basic ggplot2::ggplot() with a ggplot2::geom_sf() layer for the track
Examples
plot_track(lubridate::ymd("2020-05-20"), track_details)