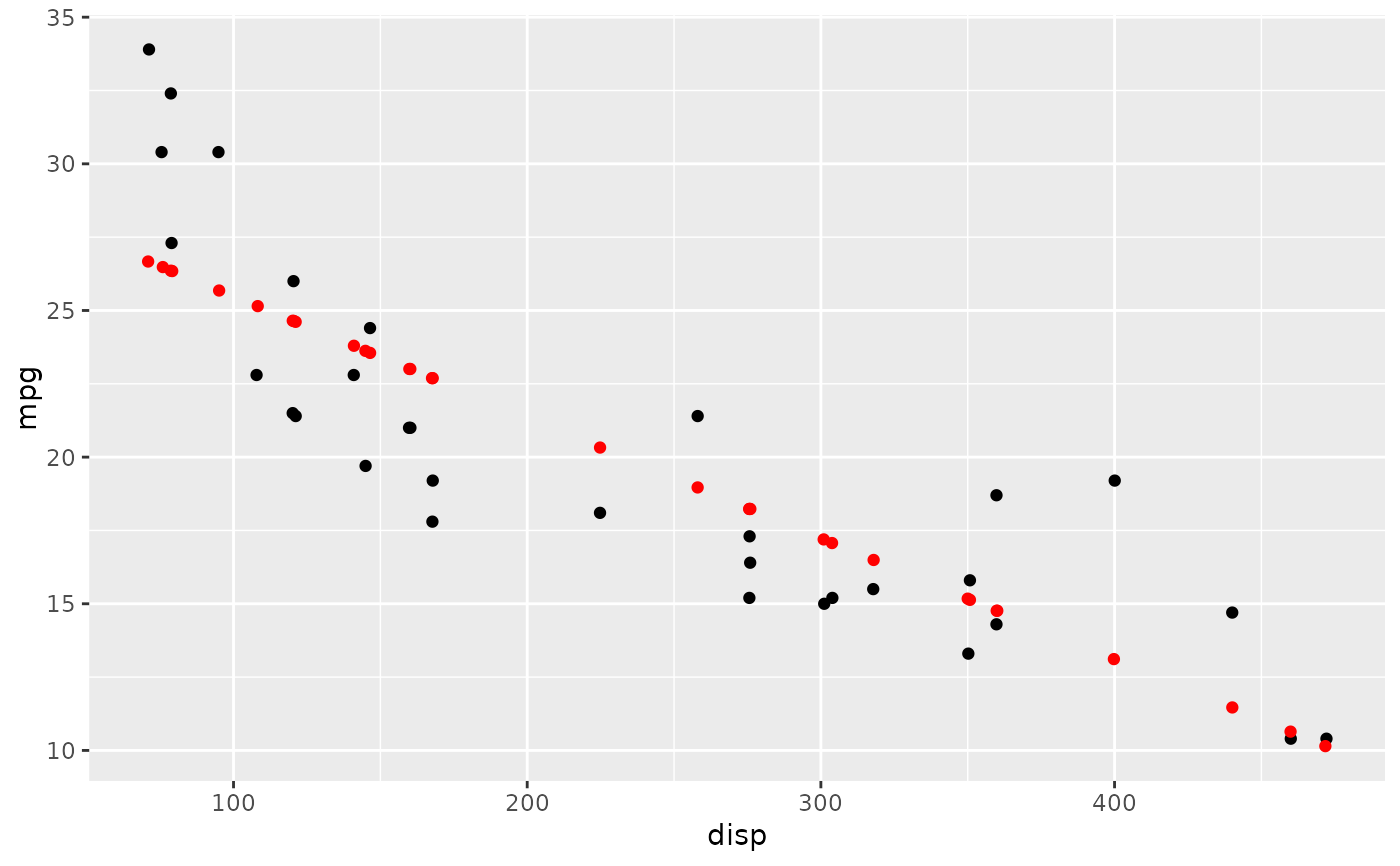
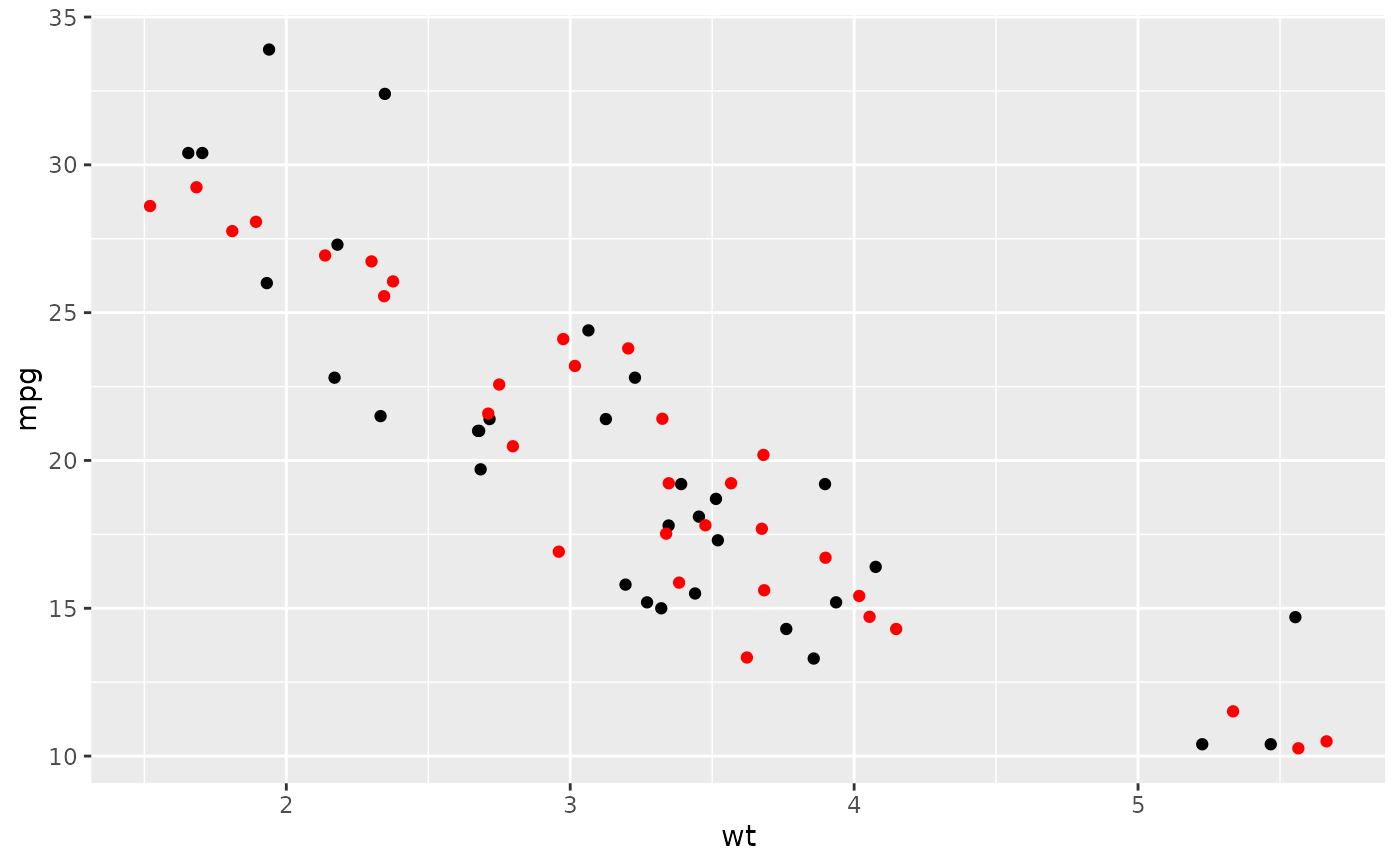
Visually Evaluate Model
plot_data_vs_fitted.RdPlot values (in black) and their corresponding fitted values (in red),
according to model.
Arguments
- model
A fitted model for which to plot its data vs its fitted values. Needs to be
broom::augment()-able.- ...
Params passed to
ggplot2::aes(). Should be the variables to plot, e.g. something likex = var1, y = var2.
Value
A ggplot2::ggplot() with two layers (points jittered in x-direction,
representing original values (in black) and fitted values (in red))